tableau de bord
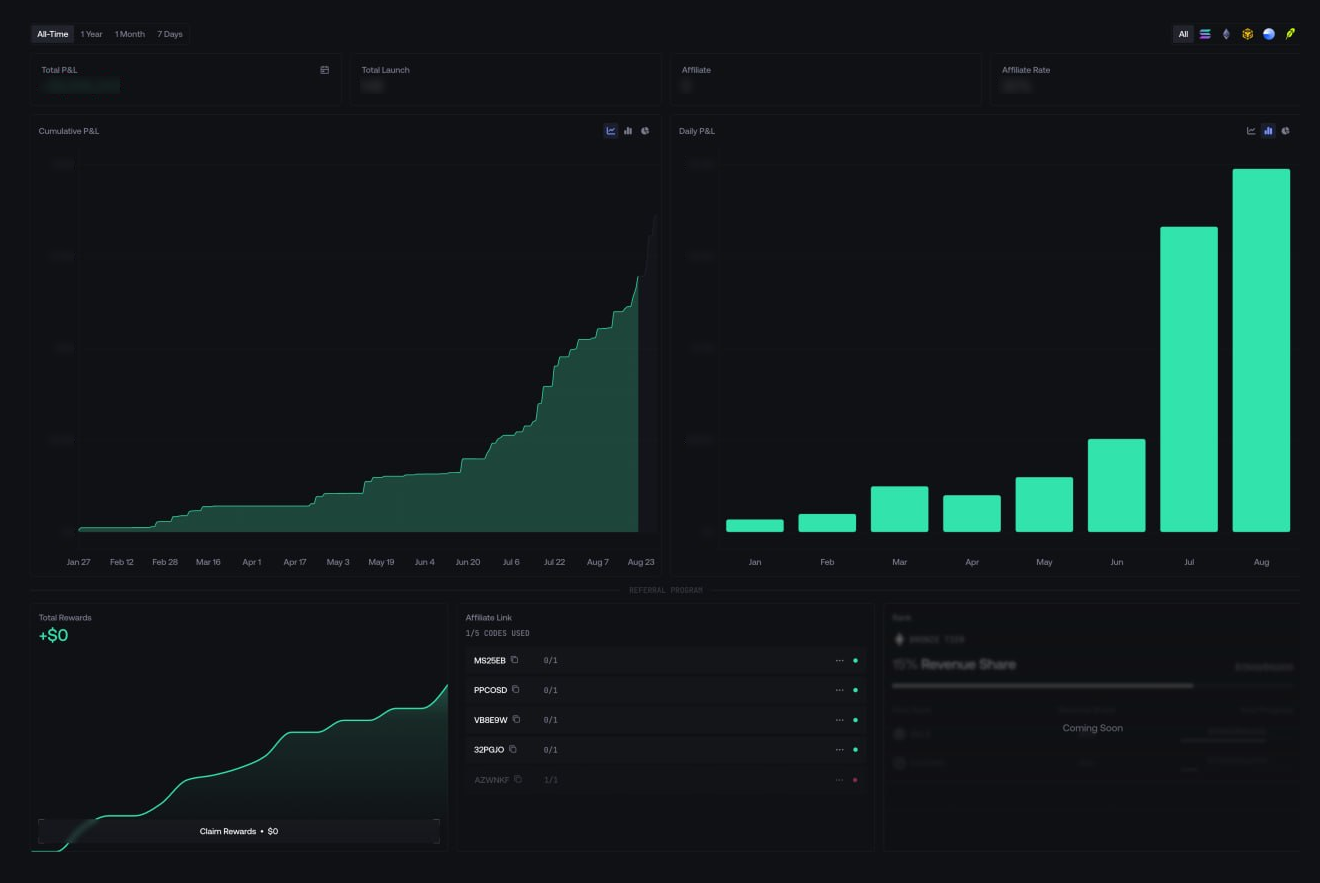
Examinez les performances du compte, les totaux launch, les graphiques et les récompenses de recommandation.
Le tableau de bord regroupe les performances du compte pour la période de temps et le réseau sélectionnés. Traitez ces filtres comme faisant partie de chaque valeur que vous lisez.
Read the account summary
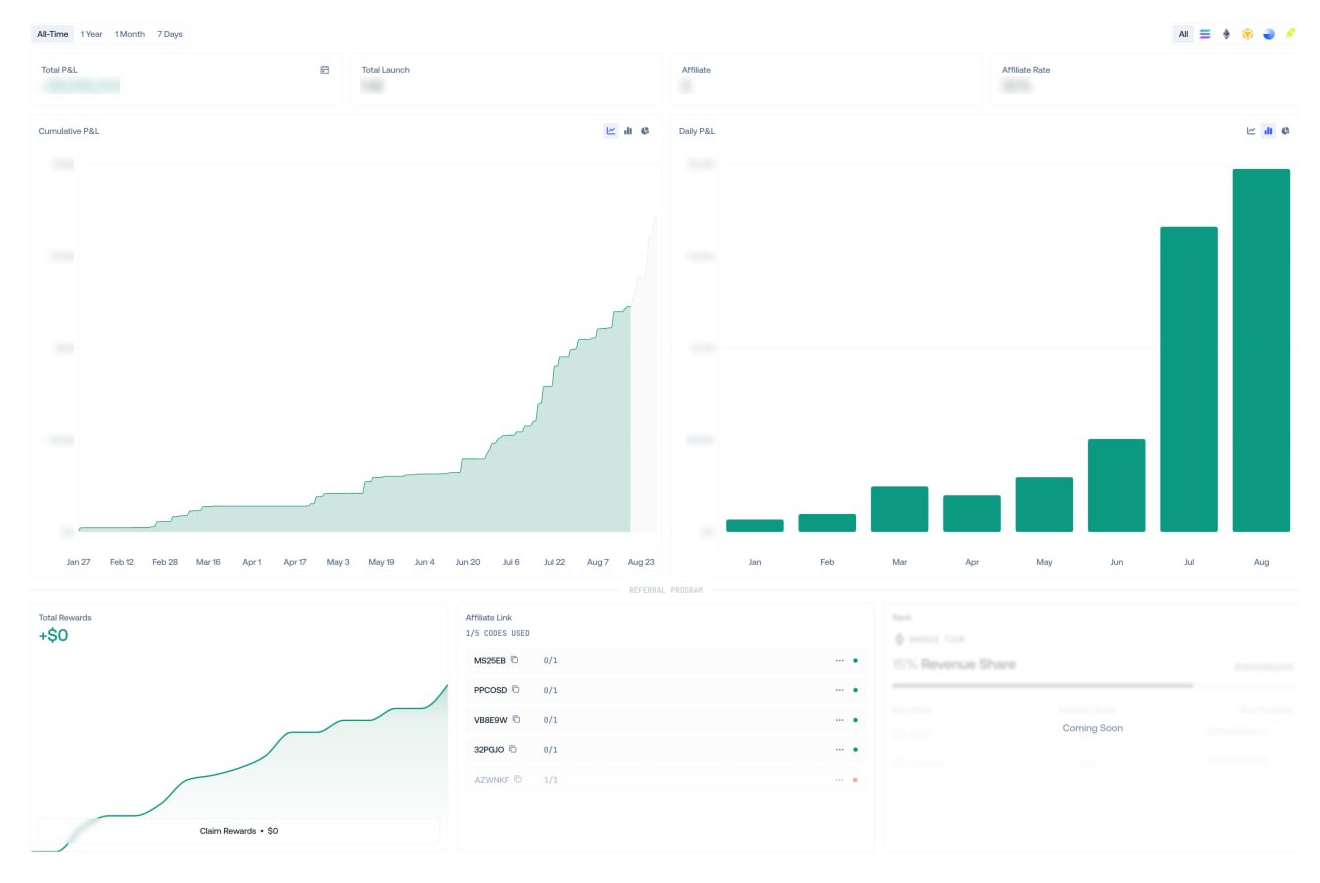
Total P&L and Total Launch follow the selected timeframe and network. Affiliate shows referred users, while Affiliate Rate shows the current referral revenue share.
All networks uses USD. Select one network to switch between USD and its native asset.
Compare performance
Each chart frame can independently show cumulative P&L, daily P&L, or Win Rate by launch count or P&L. The selected layouts are saved separately.
Hover a data point to inspect its value for the active timeframe.
Inspect a period
Open the calendar beside Total P&L, then switch between Monthly and Yearly. The calendar can show the launch count and opens Share P&L Card for the displayed period.
Manage codes and rewards
Copy an affiliate link from its code row and use the row menu to add a label. The displayed counter shows code usage and limits.
Claim Rewards can submit on-chain transactions. For USDC or USD1 rewards on Solana, the default Funder needs at least 0.01 SOL for transaction fees.
Vérifier une demande de valeur ou de récompense
Confirm the network, timeframe, currency, and chart type shown on screen.
Open Activity and find the launch actions or reward claim behind the displayed result.
For a claim, verify the destination, assets, transaction status, and resulting balance before retrying.